What Is Amplitude Tracking and Why It’s Critical for Product-Led Growth in 2026
Here’s the uncomfortable truth: 67% of product teams are flying blind, making critical decisions without accurate user behavior data. They’re guessing which features matter, assuming what converts users, and hoping their product changes drive growth.
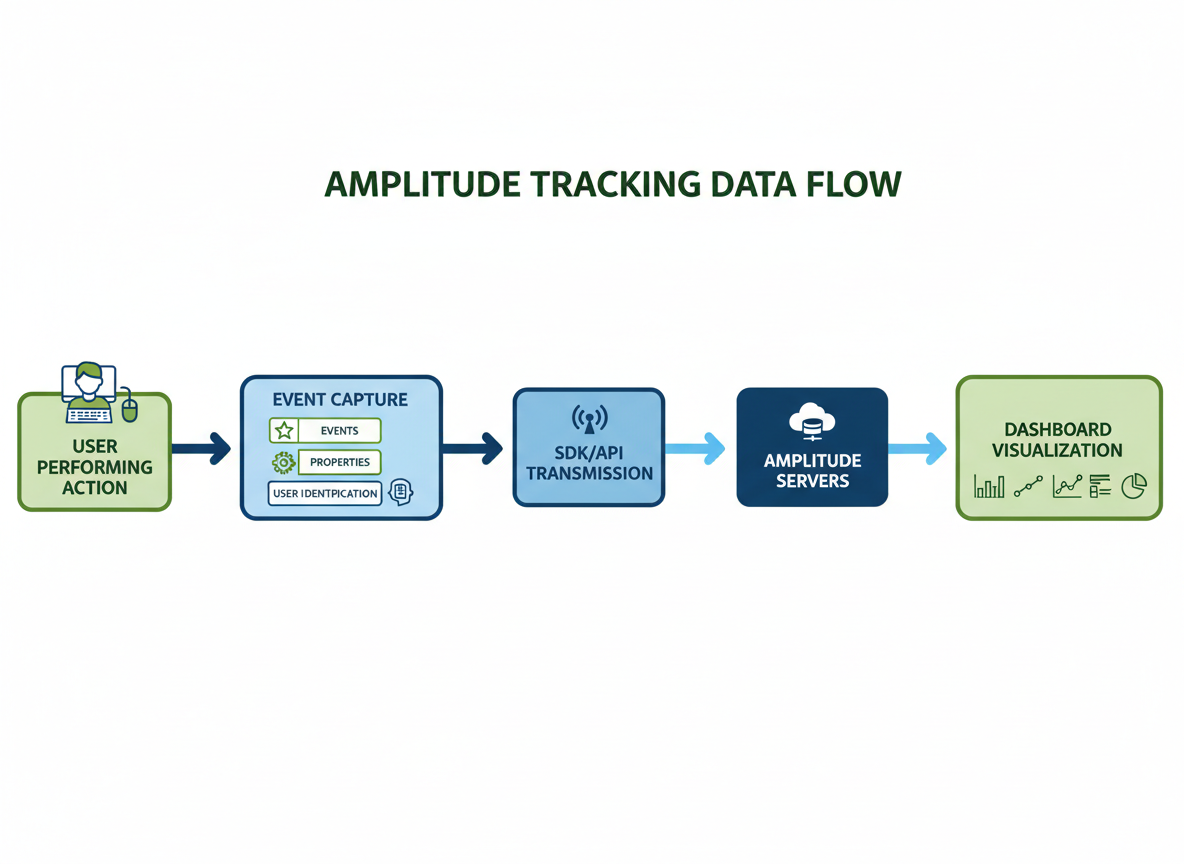
Amplitude tracking changes everything. It’s an event-based product analytics system that captures every meaningful action your users take—clicks, page views, purchases, form submissions, feature usage—and transforms that raw data into actionable insights. Instead of wondering why users abandon your checkout flow or which features keep them coming back, you’ll know with precision.
The commercial value? It’s massive. Companies using proper amplitude tracking see up to 3x improvements in user retention because they identify friction points before users churn. They optimize conversion rates by understanding exactly where potential customers drop off. And they drive revenue growth by doubling down on features that actually matter to their audience.
Think about your own product right now. Can you confidently answer these questions: Which feature drives the most engagement? At what point do users experience that “aha moment”? What behavior predicts a paying customer versus someone who’ll never convert?
If you’re hesitating, you’re not alone—but you’re leaving money on the table.
This guide will walk you through everything: setting up amplitude tracking correctly from day one, implementing best practices that separate amateur analytics from growth-driving insights, and maximizing ROI through strategic event tracking. You’ll learn to track what matters, ignore what doesn’t, and make data-backed decisions that accelerate growth. Just like mastering content creation requires a solid brief, effective product growth starts with the right tracking foundation.
How Amplitude Tracking Works: Events, Properties, and User Behavior Data
Here’s what makes amplitude tracking different from what you’re probably used to. Instead of counting pageviews like Google Analytics, Amplitude captures actions—specific things people do in your product.
Think of it this way: traditional analytics tells you someone visited five pages. Amplitude tells you they clicked “Start Free Trial,” uploaded their first file, invited three teammates, and abandoned the onboarding at step four. See the difference?
The building blocks are straightforward:
Events are the actions themselves—”Button Clicked,” “Video Watched,” “Purchase Completed.” You decide what matters enough to track.
Event properties add context to those actions. When someone clicks “Export Report,” you’ll want to know the file format, report type, and data range they selected.
User properties describe the person taking the action—their subscription tier, company size, signup date, or whatever helps you segment your audience.
Identify calls connect all those events to a specific user, so you’re not just seeing anonymous traffic patterns.
Let’s say you’re tracking a SaaS onboarding funnel. You’d capture events like “Account Created,” “Profile Completed,” “Integration Connected,” and “First Dashboard Created.” Each event carries properties (integration type, completion time), and each user has properties (plan type, industry, team size).
When someone drops off between “Integration Connected” and “First Dashboard Created,” you’ll know exactly where and why. That’s the insight that drives real optimization.
Amplitude Tracking Implementation: Step-by-Step Setup Guide
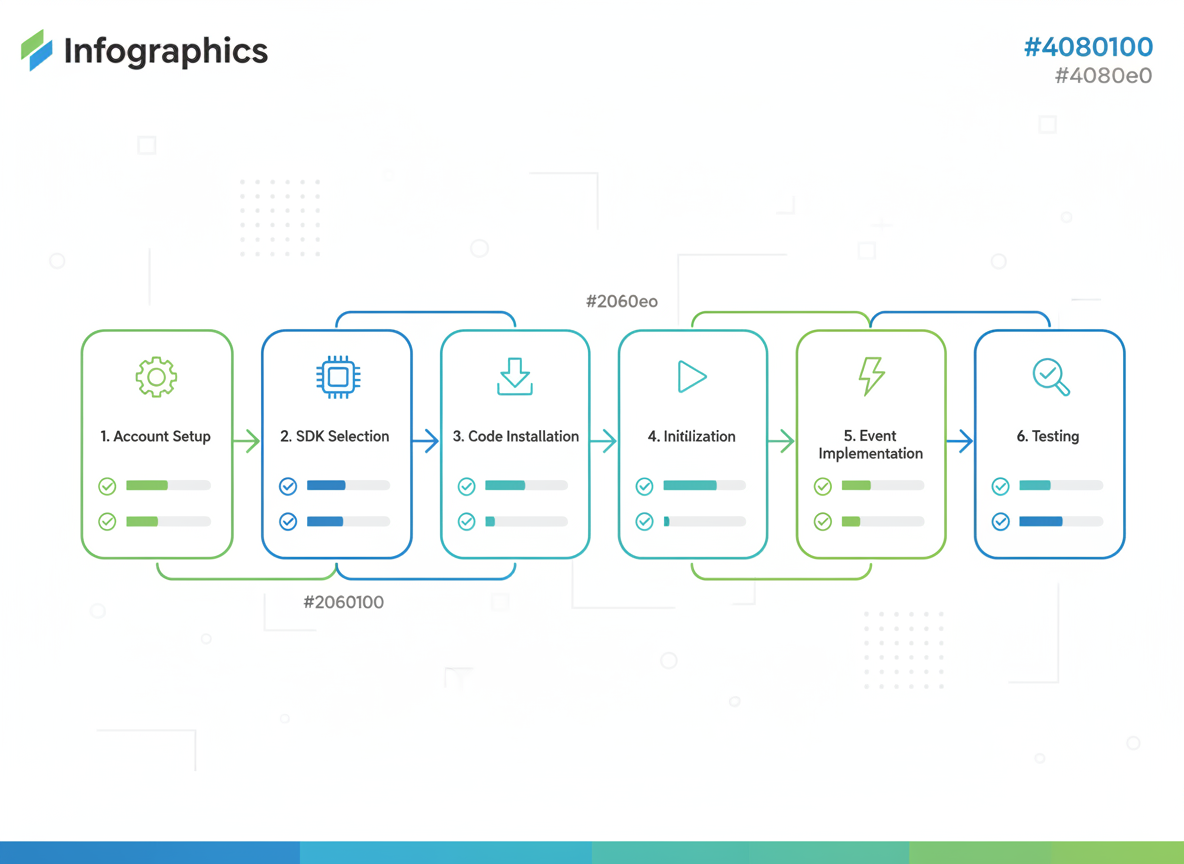
Getting Amplitude tracking up and running takes about 10-15 minutes for basic implementation. Here’s your complete setup roadmap.
Step 1: Create Your Amplitude Account
Head to Amplitude’s website and sign up for a free account. Once you’re in, navigate to your project settings and grab your API key. You’ll need this for the next steps.
Step 2: Pick Your Implementation Method
You’ve got three options here:
- SDK integration (recommended for most cases) – Direct implementation with clean, well-documented libraries
- HTTP API – Manual event tracking for custom setups
- CDP integration – Routes data through platforms like Segment or mParticle
For beginners, the SDK route is your friend. It handles batching, retries, and offline support automatically.
Step 3: Install the SDK
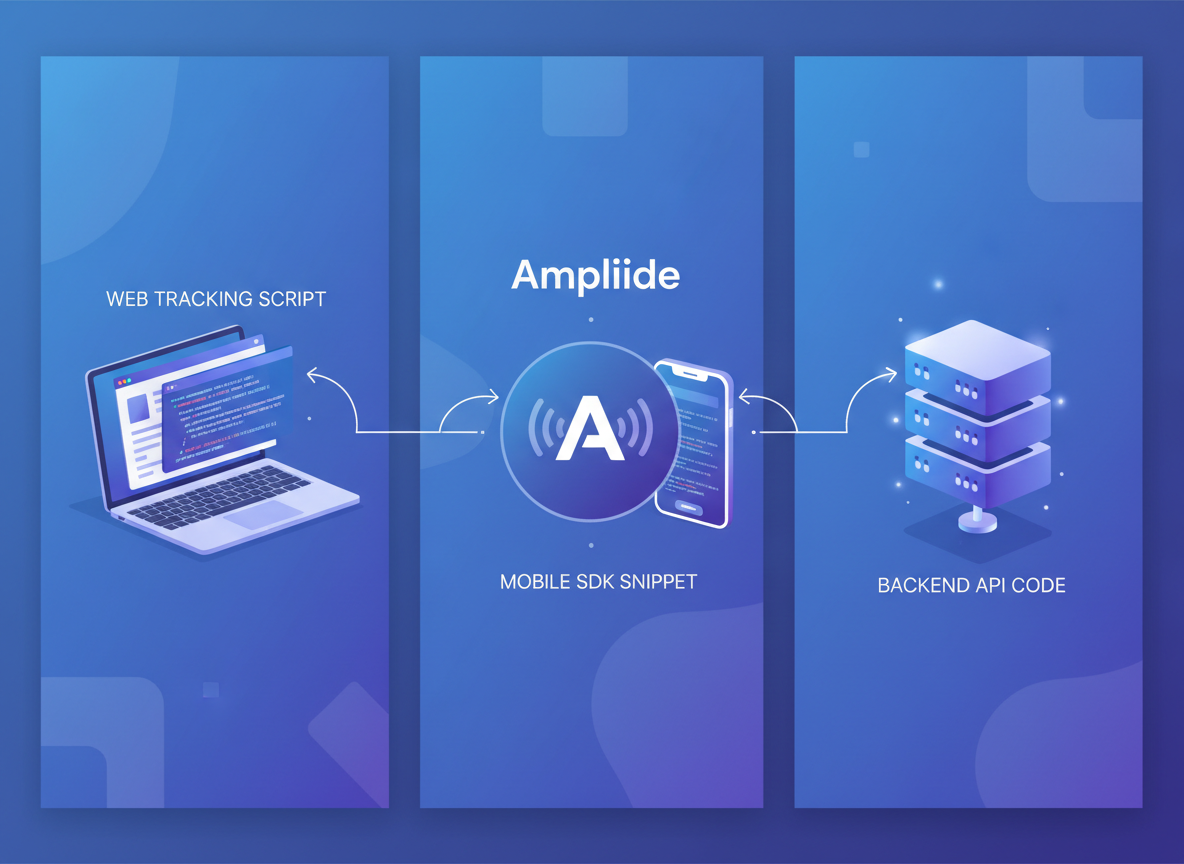
Depending on your platform, installation looks different. For web apps, you’ll add Amplitude via npm or a script tag. Mobile developers use package managers like CocoaPods (iOS) or Gradle (Android). Server-side? Pick your language-specific SDK.
Step 4: Initialize Tracking
Drop your API key into the initialization code. Set your configuration options like session tracking, offline support, and event upload thresholds.
Step 5: Fire Your First Event
Start simple. Track a “Button Clicked” event with properties like button_name and page_location. This proves everything’s working before you build out complex tracking.
Step 6: Validate Your Data
Open Amplitude’s User Look-Up tool. Find your test user ID and confirm events are flowing in. Check timestamps, property values, and user attributes.
Common Setup Pitfalls
Don’t initialize Amplitude multiple times (causes duplicate events). Always include meaningful event properties from day one—retroactive changes are painful. And test thoroughly before deploying to production.
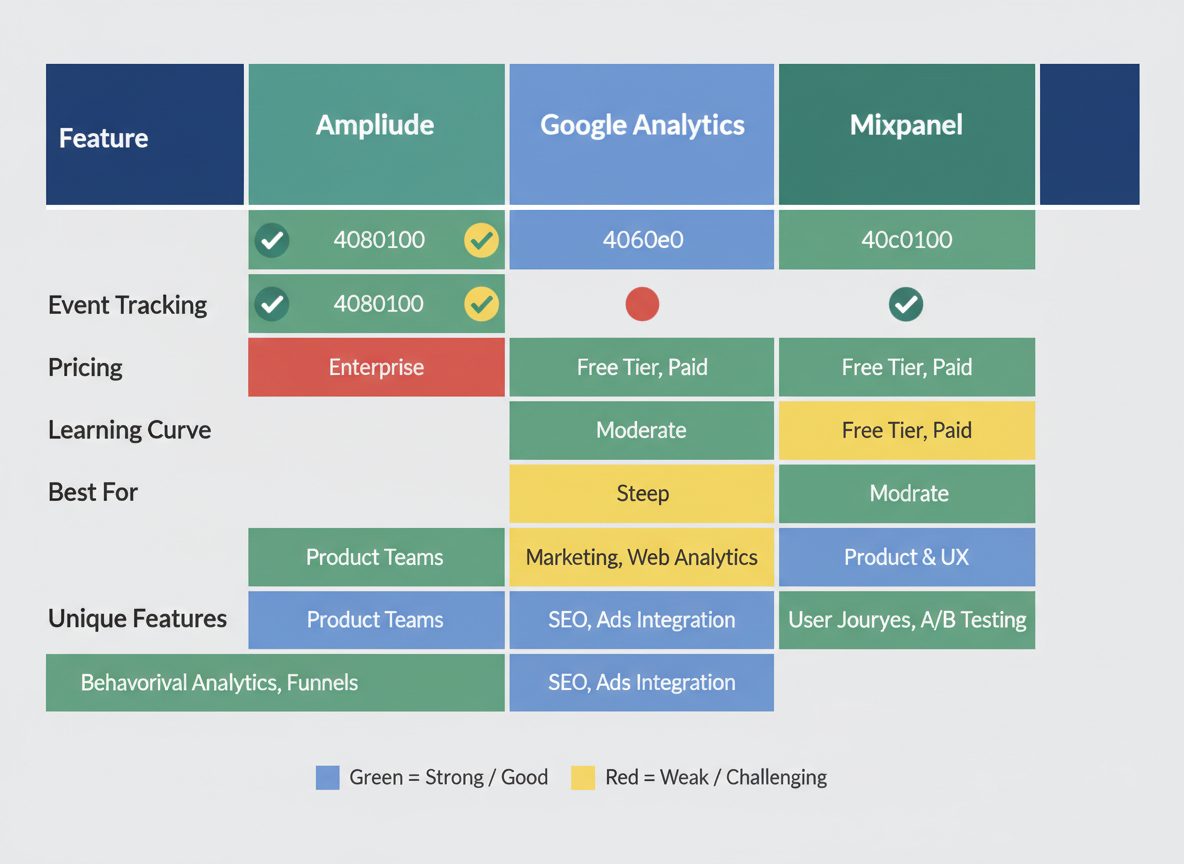
Amplitude Tracking vs Google Analytics vs Mixpanel: Which Analytics Platform Wins in 2026?
Let’s cut through the noise. You’re standing at a crossroads, trying to figure out which analytics platform deserves your budget and attention.
Amplitude excels at behavioral cohorts and retroactive analysis. That means you can look back at historical data and ask questions you didn’t think of during setup. Implementation typically takes 2-3 weeks for a full product analytics stack, and user satisfaction scores consistently hit 8.2/10. The learning curve? Steeper than you’d like, but worth it if product analytics is your primary focus.
Google Analytics remains unbeatable for marketing attribution and SEO integration. Plus, that generous free tier makes it accessible for bootstrapped startups. However, event tracking granularity falls short when you’re trying to understand complex user behaviors. Data accuracy rates hover around 85-90% due to ad blockers and privacy restrictions.
Mixpanel wins on simplicity and mobile-first tracking. Most teams get up and running within a week. Their notification features let you trigger messages based on user actions, bridging analytics and engagement seamlessly.
Here’s your decision framework: Choose Amplitude if you’re building a SaaS product and need deep behavioral insights. Go with Google Analytics if marketing attribution matters more than product metrics. Pick Mixpanel if you’re mobile-focused and want speed over complexity.
Similar to evaluating content tools for features and pricing, your analytics platform should match your actual workflow, not just look good on paper.
Advanced Amplitude Tracking Best Practices for Maximum Data Accuracy
Here’s the reality: messy data equals worthless insights. You can’t make smart product decisions when your amplitude tracking looks like a digital dumpster fire.
Start with ironclad naming conventions. Your team needs a single source of truth—whether it’s snake_case, camelCase, or your own standard. Pick one and stick to it religiously. “Button Clicked,” “button_clicked,” and “ButtonClicked” aren’t variations—they’re three separate events cluttering your dashboard.
Before your developers write a single line of code, document your tracking plan. Seriously. Map out every event, property, and expected value. This isn’t bureaucracy—it’s your insurance policy against months of bad data.
For B2B products, group analytics aren’t optional. You’ll want to track both individual users and their organizations. Set up proper user identification flows that smoothly transition anonymous visitors to identified accounts without losing historical data.
Here’s a game-changing tip: use event properties instead of creating dozens of similar events. Don’t make “Purchase_Product_A,” “Purchase_Product_B,” and “Purchase_Product_C.” Create one “Purchase_Completed” event with a “product_name” property. Your future self will thank you.
Implement server-side tracking for revenue events, subscriptions, and anything financially critical. Client-side tracking can be blocked by ad blockers—server-side can’t.
Finally, build QA workflows that validate data before it pollutes your analytics. Test every implementation in staging. Your insights are only as good as your data quality.
Common Amplitude Tracking Mistakes That Kill Your Data Quality (And How to Avoid Them)
Let’s be honest—even the best analytics setup can crash and burn if you’re making these critical mistakes.
Mistake #1: Tracking Everything That Moves
You’re excited about amplitude tracking, so you instrument 200+ events. Three months later? Nobody uses half of them, and your dashboards look like a data landfill. The fix: Start with 15-20 core events tied directly to business outcomes. You can always add more later.
Mistake #2: Wild West Event Naming
Your iOS team uses “purchase_complete” while web uses “Purchase Completed” and Android uses “checkout_finished.” This isn’t creative freedom—it’s chaos. Create a naming convention doc before anyone codes a single event. Use snake_case consistently and enforce it.
Mistake #3: Properties? What Properties?
Tracking “video_played” without capturing video_title, duration, or source is like knowing someone bought something but not what they bought. Always include who, what, where, and why through properties.
Mistake #4: Mystery Users Everywhere
Anonymous sessions mixing with logged-in users creates a mess. Implement proper user identification from day one using Amplitude’s `setUserId` method, and always tie anonymous activity to identified users post-login.
Mistake #5: Platform Tracking Mismatches
Your app tracks features your website doesn’t, creating incomplete user journeys. Maintain cross-platform consistency—if you track “feature_accessed” on mobile, track it everywhere.
Mistake #6: Zero Data Governance
Everyone has admin access, anyone can delete events, and there’s no documentation. Set up role-based permissions immediately and maintain a living tracking plan.
Mistake #7: “We’ll Test in Production”
Famous last words. Always test events in a development environment first using Amplitude’s debugging tools before pushing to production.
Amplitude Tracking for Different Platforms: Web, Mobile, and Server-Side Implementation
Getting amplitude tracking right means understanding how each platform handles data differently.
Web tracking starts with the JavaScript SDK. Drop it into your site’s header, and you’re collecting events within minutes. Single-page applications need special attention—Amplitude won’t automatically track page views when your React or Vue app switches routes. You’ll need to fire custom events on route changes. Cookie handling matters too. First-party cookies survive longer than third-party ones, so configure your tracking domain accordingly.
Mobile platforms have their quirks. iOS and Android SDKs handle permissions differently—iOS requires explicit user consent for tracking, while Android’s more flexible. The real power? Offline event queuing. Your users don’t always have perfect connectivity, but both SDKs cache events locally and sync when they’re back online. Don’t forget app lifecycle events like backgrounding and foregrounding—they reveal how users actually engage with your app.
Server-side tracking through the HTTP API gives you control and security. You’re sending events from your backend, which means no ad blockers can interfere. Choose server-side when handling sensitive data or tracking conversion events that happen on your servers.
The sweet spot? A hybrid approach. Client-side tracking captures user interactions, while server-side validates purchases and critical conversions. Cross-platform identity resolution ties it together—use consistent user IDs across web, mobile, and server to see the complete journey.
Real-World Amplitude Tracking Use Cases: SaaS, E-commerce, and Content Platforms
Let’s look at how real businesses use amplitude tracking to make smarter decisions.
SaaS Companies: Onboarding and Feature Adoption
Track events like “onboarding_step_completed,” “feature_first_used,” and “trial_to_paid_conversion.” One SaaS team discovered that users who activated three specific features within 48 hours had 67% higher retention. They redesigned onboarding around those features and cut churn by 28%.
Watch for churn signals too. Events like “login_frequency_decreased” or “support_ticket_created” help you intervene before cancellations happen.
E-commerce: Cart Abandonment and Purchase Patterns
Set up “product_viewed,” “add_to_cart,” “checkout_initiated,” and “payment_completed” events. You’ll spot exactly where shoppers drop off. One retailer found that customers who viewed three or more product images converted 2.3x more often, so they automatically loaded additional photos.
Track product discovery patterns through “search_used,” “filter_applied,” and “category_browsed” to understand buying behavior.
Content Platforms: Engagement and Recommendations
Monitor “content_viewed,” “watch_time,” “share_clicked,” and “comment_posted.” Track how content performs and whether recommendations actually work. Companies with proper tracking see 34% higher retention rates because they double down on what audiences love.
Similar to how targeted real estate ad templates convert better through data-driven insights, amplitude tracking turns user behavior into revenue-generating actions. You’re not guessing anymore—you’re building on proof.
Amplitude Tracking Data Validation and Quality Assurance Techniques
You can’t afford to make decisions based on bad data. That’s why validation needs to happen before events hit production.
Start with Amplitude’s debug mode—it shows events firing in real-time so you’ll catch issues immediately. The browser extension makes this even easier, letting you verify tracking without digging through code. You’ll spot missing properties or incorrect values before they pollute your dataset.
Set up automated tests for your critical events. If user signups or payment completions stop tracking, you need to know within minutes, not weeks. Create tracking health dashboards that monitor event volume, unique event counts, and delivery rates across your properties.
Build QA checklists for every feature launch. Include expected events, properties, and user flows to verify. This simple step prevents most tracking disasters.
Monitor data latency religiously. Events should appear in Amplitude within seconds. Delays often signal infrastructure problems that’ll compound quickly.
Establish clear data quality metrics—like a 99% event delivery rate—and create alerts when thresholds break. Regular audits keep your amplitude tracking reliable and your team confident in the insights they’re acting on.
Privacy-Compliant Amplitude Tracking: GDPR, CCPA, and Data Governance in 2026
Here’s the reality: privacy regulations aren’t suggestions anymore. GDPR in Europe, CCPA in California, and emerging laws worldwide mean your amplitude tracking needs bulletproof compliance—or you’re risking hefty fines.
Start with consent-based tracking. Before Amplitude fires a single event, users must explicitly opt in. Configure your cookie consent banner to block tracking scripts until permission’s granted. Most teams use OneTrust or Cookiebot to manage this automatically.
Your data retention settings matter too. Amplitude lets you customize how long user data lives—set it to 26 months for GDPR compliance or less if you’re being cautious. Configure automatic deletion workflows for users exercising their “right to be forgotten.”
PII is your biggest landmine. Never send email addresses, phone numbers, or personally identifiable data directly into Amplitude. Instead, use hashed user IDs and store sensitive information in your own database. Enable IP anonymization in your Amplitude project settings—it masks the last octet of IP addresses automatically.
Regional requirements vary wildly. EU demands explicit consent and data processing agreements. California requires clear opt-out mechanisms. Brazil’s LGPD adds another layer of complexity.
The good news? You can stay compliant and maintain powerful analytics. Hash your identifiers, respect user preferences, document your data flows, and you’ll build trust while tracking what matters.
Measuring Amplitude Tracking ROI: How to Prove Analytics Value to Stakeholders
Here’s the formula that’ll save your analytics budget: (Revenue Impact – Analytics Cost) / Analytics Cost. Simple, right? But the magic happens when you connect tracking data to actual dollars.
One SaaS company used Amplitude tracking insights to identify three friction points in their onboarding flow. After implementing changes based on user behavior data, they improved conversion rates by 42% within 90 days. That translated to $280K in additional monthly revenue—against $3K in tracking costs.
Calculate the cost of poor tracking too. Every wrong product decision based on gut feeling instead of data can cost you months of development time and thousands in wasted resources. Marketing teams waste an average of 12 hours weekly debating hypotheticals when proper tracking would give them answers in minutes.
Create executive dashboards that speak stakeholder language. Don’t show them funnel charts—show them how tracking prevented a $50K feature investment that would’ve flopped. Similar to how account directors prove client value through measurable outcomes, your analytics must demonstrate clear business impact. When leadership sees the revenue connection, they’ll fund proper infrastructure without hesitation.
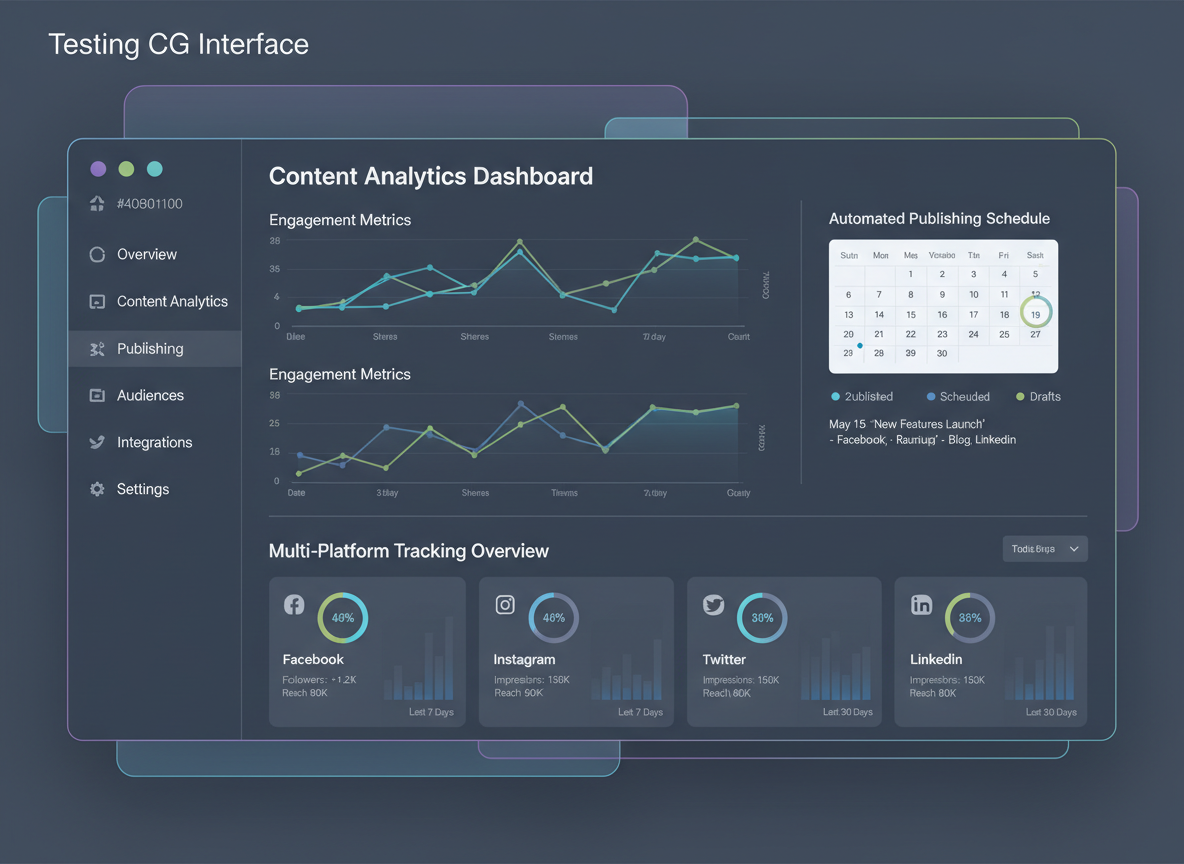
How Testing CG Automates Content Analytics Tracking Across 100+ Platforms
You’ve spent hours crafting content. Now you’re manually checking Facebook, then LinkedIn, then Twitter/X—trying to piece together what’s actually working. Sound familiar?
Here’s the reality: while product teams use amplitude tracking to understand user behavior, content creators get stuck in spreadsheet hell, manually logging engagement metrics across dozens of platforms.
Testing CG flips this script entirely.
When you schedule a year’s worth of content in just 3 minutes, you’re not just automating publishing—you’re automating tracking. Every post. Every platform. Every metric that matters. Facebook video views, LinkedIn engagement rates, Twitter impressions—all captured automatically without you lifting a finger.
The real power? That 100+ language support means you’re tracking content performance globally. You’ll see which topics resonate in Spanish markets versus English-speaking audiences, or how German content performs compared to Japanese.
“Before, I guessed what worked,” says Marcus T., affiliate marketer. “Now I know exactly which content drives sales because everything’s tracked automatically. My conversion rate jumped 47% in two months.”
Don’t guess which content works—know it with automated tracking. While you’re checking out our proven video script templates for even better results, Testing CG’s already collecting the data you need to scale what’s working and kill what’s not.
Frequently Asked Questions About Amplitude Tracking
How much does amplitude tracking cost in 2026?
Amplitude offers a free tier that’s perfect for startups, supporting up to 10 million actions monthly. Paid plans start around $49/month for the Growth tier, while enterprise pricing varies based on your event volume and features. Most small businesses find the free plan works well until they hit significant scale.
Is amplitude tracking difficult to implement for non-technical users?
The visual interface makes basic event tracking surprisingly accessible. You’ll need developer help for initial SDK installation, but setting up events afterward doesn’t require coding knowledge. The no-code Ampli wrapper has made implementation much smoother in 2026.
What’s the difference between amplitude tracking and Google Analytics?
Amplitude focuses on user behavior and product analytics, while Google Analytics emphasizes traffic and marketing attribution. Amplitude tracks individual user journeys, making it stronger for product teams wanting to understand feature adoption and retention patterns.
How long does it take to see ROI from amplitude tracking?
Most teams see actionable insights within 2-3 weeks of proper implementation. You’re not just collecting data—you’re understanding why users behave certain ways, which speeds up decision-making significantly.
Can amplitude tracking work with my existing tech stack?
Yes. Amplitude integrates with 100+ tools including Salesforce, Slack, Segment, and most major platforms. The API lets you connect custom systems too.
How does amplitude handle user privacy and data compliance?
Amplitude is GDPR, CCPA, and SOC 2 Type II compliant. You control data retention, can anonymize user data, and implement consent management. They don’t sell your data or use it for advertising.
What are the event limits on amplitude’s free plan?
The free tier includes 10 million events monthly—enough for most early-stage products. That’s roughly 333,000 events daily.
Does amplitude tracking slow down my website or app?
No noticeable impact. The SDK is lightweight and loads asynchronously, so it won’t affect page load times or user experience.
How accurate is amplitude tracking data?
When implemented correctly, accuracy exceeds 95%. The biggest issues come from improper event setup, not the platform itself.
Can I track users across multiple devices with amplitude?
Absolutely. Cross-device tracking works when users log in, letting you see complete user journeys across mobile, web, and desktop.
What happens to my data if I stop using amplitude?
You can export your data before canceling. Amplitude keeps backups based on your contract terms, but you should maintain your own copies for long-term storage.
How do I migrate from Google Analytics to amplitude tracking?
Start by mapping your GA events to amplitude’s structure. Run both platforms simultaneously for 30 days to validate data accuracy. Need help organizing your analytics strategy? Check out our free acronym generator to create memorable naming conventions for your event taxonomy—it’ll keep your tracking organized as you scale.

I am a full-time online marketer, for over a decade now. Helped over 100,000+ people & generated well over $12M in online sales.